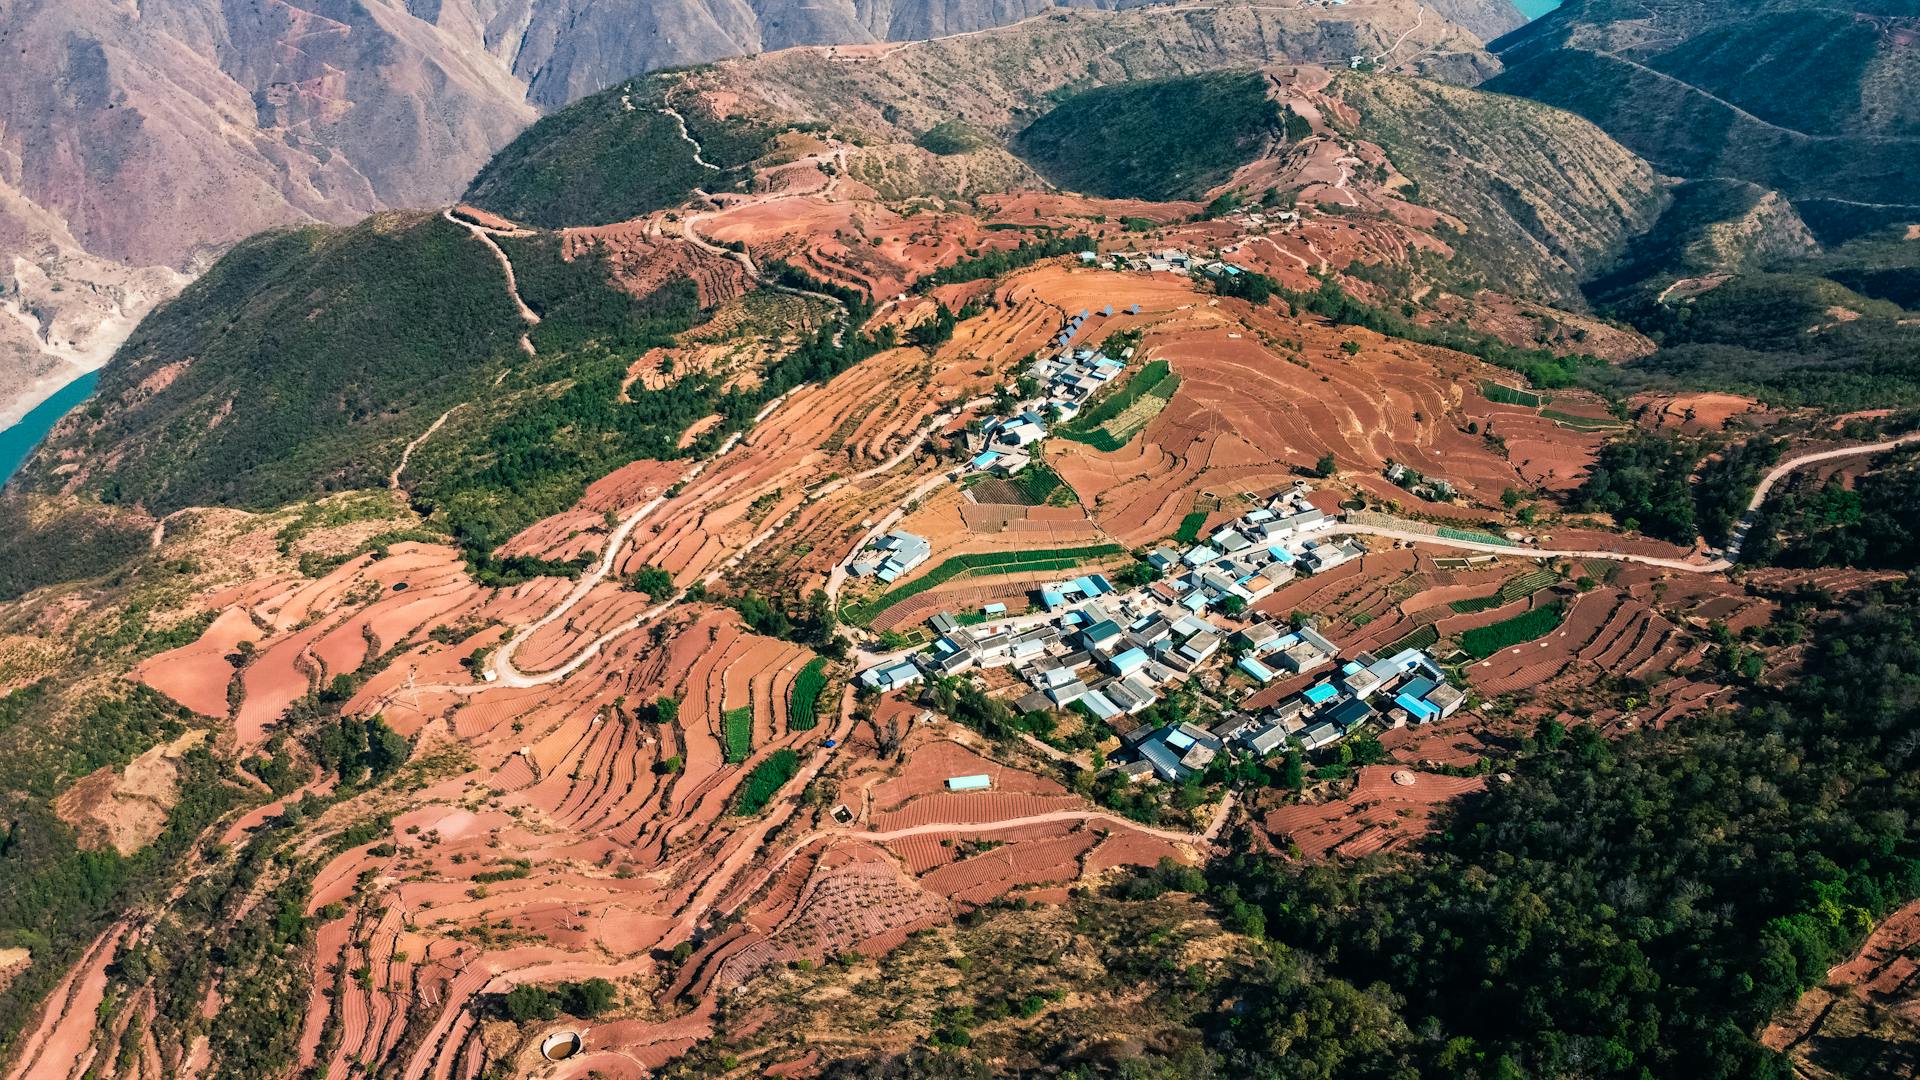
An above mean sea level map is a crucial tool for outdoor enthusiasts, emergency responders, and anyone who ventures into the wilderness. It's a map that shows the elevation of an area relative to sea level.
The map uses a color-coded system to indicate different elevation levels, with lower elevations shown in shades of blue and higher elevations shown in shades of green and brown.
The key to understanding an above mean sea level map is knowing what the contour lines represent. Contour lines are imaginary lines that connect points of equal elevation.
Contour lines come in different intervals, such as 10 or 20 meters, and each interval represents a specific change in elevation.
What Is an Elevation Map?
An elevation map is a powerful tool that has been around for centuries. It's an essential tool for navigation, particularly for pilots and sailors who need to understand the shape and height of the terrain to navigate through mountains and coastal waters.
Elevation maps are also crucial for environmental scientists who study the relationship between the Earth's surface and the environment. They use elevation maps to identify watersheds, which are areas of land that drain into a particular body of water.
Tourists can also benefit from elevation maps, especially in mountainous regions or areas with scenic overlooks. They can use elevation maps to identify popular hiking trails or scenic routes, and even create 3D maps and virtual reality experiences.
Elevation maps are not just limited to these uses; they're also critical for the military and defense industries. Military strategists use elevation maps to plan their movements and identify areas of cover and concealment.
Here are some key benefits of elevation maps:
- Navigation: Elevation maps help pilots and sailors navigate through mountains and coastal waters.
- Environmental Science: Elevation maps help environmental scientists study the relationship between the Earth's surface and the environment.
- Tourism: Elevation maps help tourists identify popular hiking trails or scenic routes.
- Military and Defense: Elevation maps help military strategists plan their movements and identify areas of cover and concealment.
Creating an Above Mean Sea Level Map
Elevation maps have been around for centuries, and their uses and benefits have only grown with the advancement of technology. Elevation maps are an essential tool for navigation, particularly in mountainous regions or areas with scenic overlooks.
Tourists can use elevation maps to identify popular hiking trails or scenic routes, and hypsometric tinting can be used to highlight important features such as mountains and valleys. By understanding the topography of the land, military strategists can plan their movements and identify areas of cover and concealment.
Elevation maps can be used to create 3D maps and virtual reality experiences, which can give tourists a realistic and immersive view of the landscape. This is especially useful for exploring the planet, from the highest peaks to the deepest ocean trenches.
To create an above mean sea level map, you can use GeoElevationData, which gives the elevation above sea level at a specific geographic location. For example, you can use GeoElevationData[loc] to get the elevation at the geographic location loc.
Here's a table showing how to use GeoElevationData:
By using GeoElevationData, you can create an above mean sea level map that provides a detailed and accurate representation of the Earth's surface.
Tools and Techniques
To create an above mean sea level map, you'll need a few essential tools and techniques.
A digital elevation model (DEM) is a crucial tool for creating an above mean sea level map.
DEM data can be obtained from various sources, including the US Geological Survey (USGS) and the National Geospatial-Intelligence Agency (NGA).
A DEM provides a 3D representation of the Earth's surface, which is essential for determining elevation above mean sea level.
To process DEM data, you'll need specialized software such as ArcGIS or QGIS.
These software programs allow you to manipulate and analyze the DEM data, making it easier to create an above mean sea level map.
You can also use online tools like the USGS's EarthExplorer to download and process DEM data.
The EarthExplorer tool provides a user-friendly interface for searching and downloading DEM data from various sources.
To ensure accuracy, it's essential to use DEM data with a high spatial resolution, such as 1-meter or 10-meter resolution.
A higher spatial resolution provides more detailed information, which is crucial for creating an accurate above mean sea level map.
Background and Context
The concept of an above mean sea level map is rooted in the idea that sea levels can fluctuate due to various factors, including climate change and human activities.
The mean sea level is the average height of the sea surface over a specific period, usually 19 years.
Sea levels have been rising over the past century, with an average rate of about 3.2 millimeters per year.
This rise in sea levels is primarily caused by the melting of glaciers and ice sheets, as well as the thermal expansion of seawater as it warms.
The above mean sea level map is a crucial tool for understanding and visualizing these changes, allowing us to see the impact of rising sea levels on coastlines and communities.
In the United States, for example, sea levels have risen by about 5-9 inches over the past century, with some areas experiencing even greater increases.
Understanding the context of sea level rise is essential for developing effective strategies to mitigate its effects and protect vulnerable communities.
Frequently Asked Questions
How to find out how far above sea level your house is?
To find your house's elevation above sea level, use a topographic map and locate the contour line that passes through your house. The number on this line indicates your house's elevation in feet or meters.
Sources
- https://www.usgs.gov/programs/national-geospatial-program/national-map
- https://vividmaps.com/united-states-elevation/
- https://www.whiteclouds.com/articles/elevation-maps/
- https://www.esri.com/about/newsroom/arcwatch/map-sea-level-rise-with-arcgis-online/
- https://reference.wolfram.com/language/ref/GeoElevationData.html.en
Featured Images: pexels.com


